Any Love for Making Dashboard Graphs Easier to Compare Two Days?

The dashboard display is a powerful tool for understanding how changes in camera configuration and ancillary usage alter CPU, network, and drive loads. Its graphs are very easy to interpret WITHIN a day. However, when used to compare loads across days, even between two consecutive days, flipping between days can confound visual interpretations. What looks like an increase, decrease, or stable usage is likely just the effect of the Y-axis being re-normalized for each day.
For instance, here are two consecutive days shown in Dashboard.
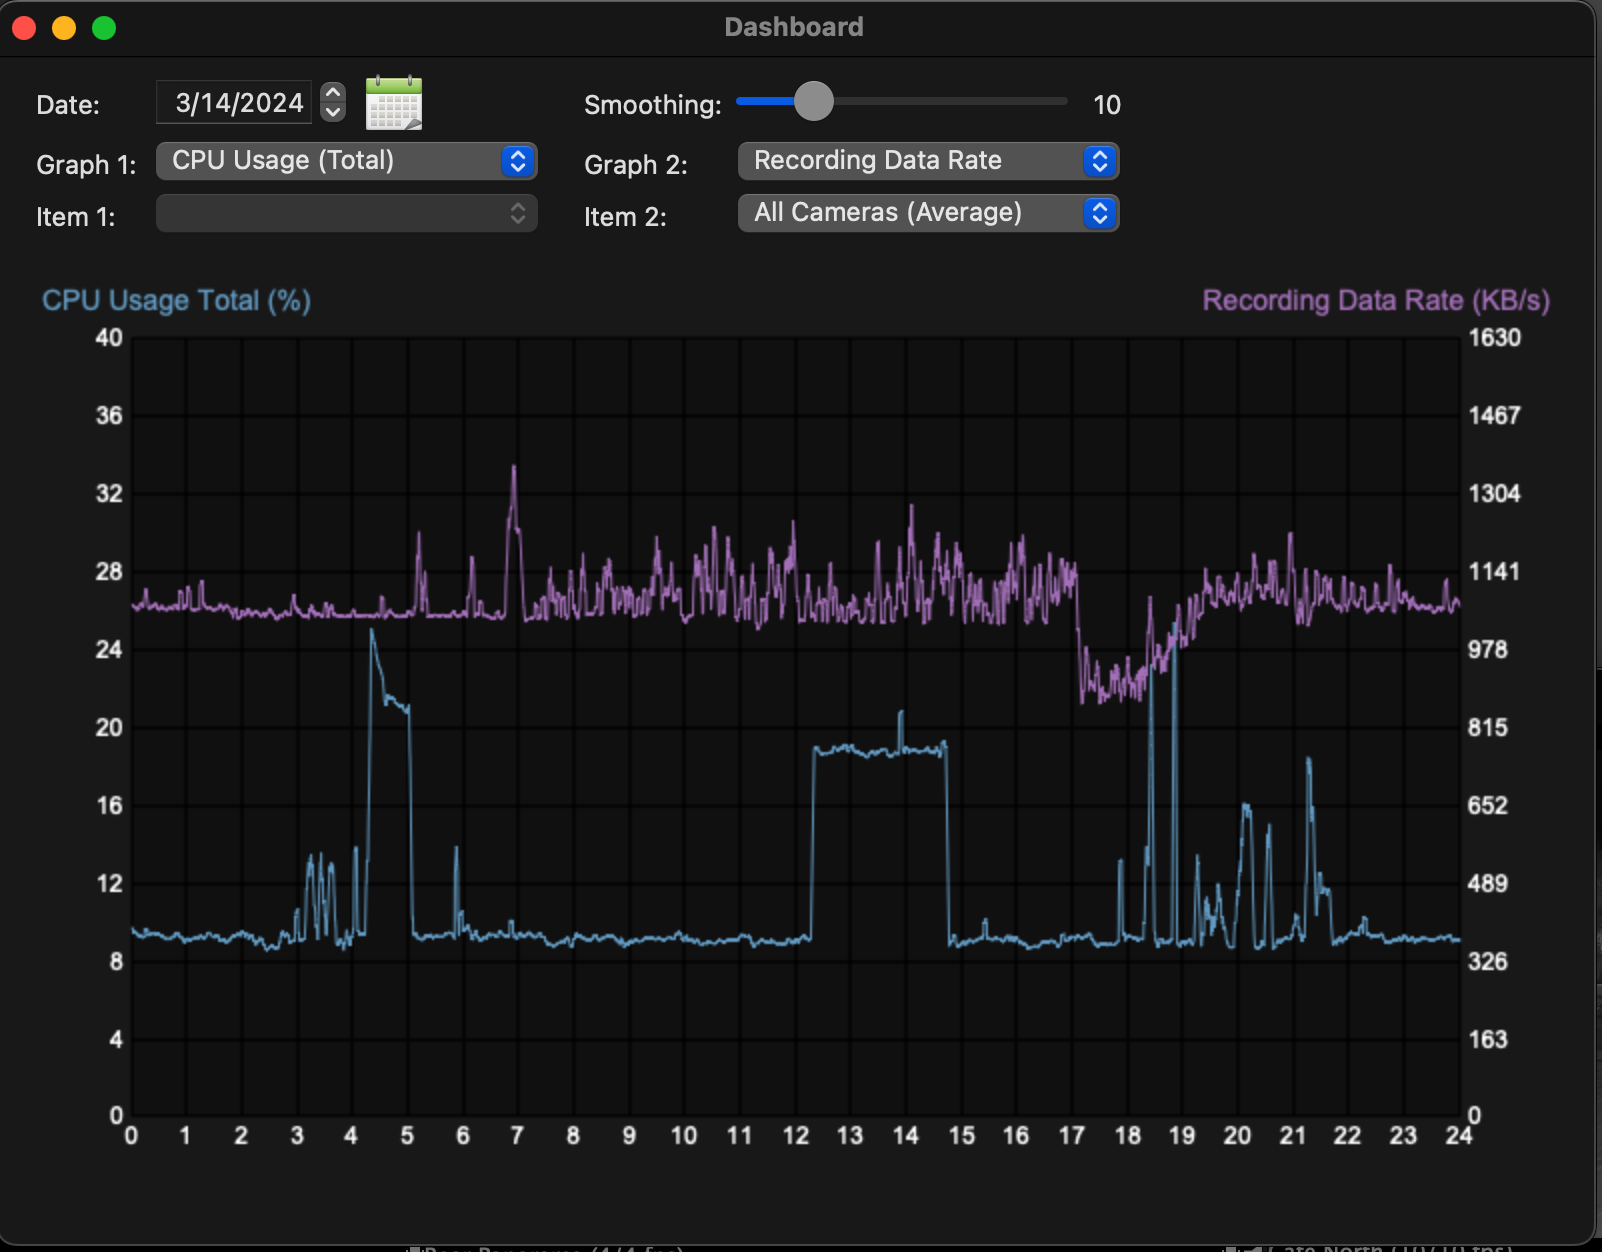
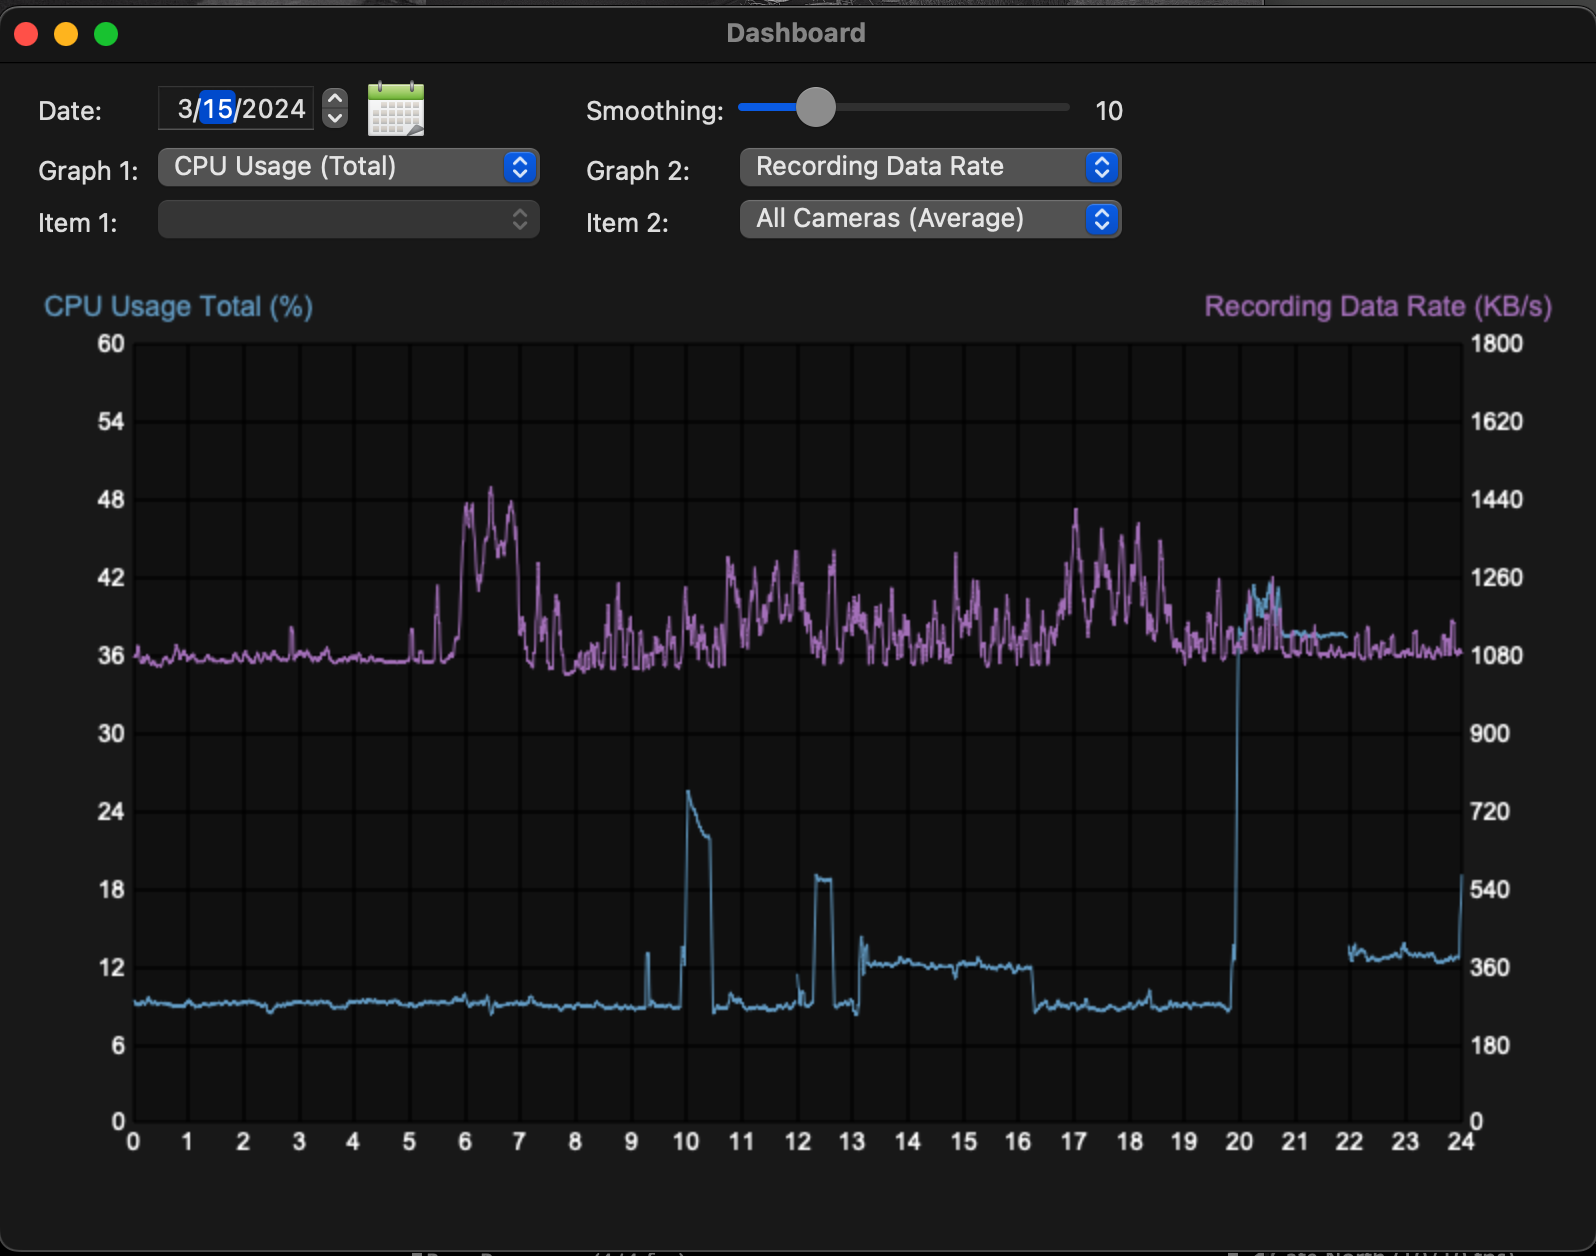
Notice how the y-axis is changed every single time one changes day being display. This make is nigh impossible to visually compare loads of different days. Instead, one must use the scales on each day to arrive at numerical values for comparison. One cannot simply see the graph move up with load increase. That change in graphing position is controlled by always unpredictable Y scaling.
I can see how normalizing for one day makes sense if one is only interested in the current day, but I also would like to compare different days quickly. Could we stabilize the Y-axis scaling across several days? I'd be happy if the normalization was across one week. I'd even be happy if I had to manually set the scaling.
Then, one could click back a day at time and rapidly assess whether loads are changing as expected. The present rescaling with every day system makes visual comparison impossible or misleading (if one doesn't mentally compensate for the every changing y-scaling)
Comments
-
Thanks for the suggestion. I think it's a good one, and I do see the value of being able to compare the same measure at the same scale between different days. I'll see what we can do for the future, although I can't promise anything - it's probably not something that would be used by a significant number of users. Although definitely a nice "power user" feature for sure.
-
It would be a power user capability. Sometimes, I am interested in how adding or changing cameras and their settings is affecting loads on the SS machine. How much did the latest firmware alter camera bitrates? Did VBR vs CBR compression materially change recording rates? Did the exposure values alter incoming data rate? Are the increments in CPU, GPU, and memory as I add a camera model suggest there is enough headroom left for a couple more cameras? etc....
It may take comparison of several days to arrive at a useful conclusion. Presently, it is a bit cumbersome to translate each days' graph for comparison against another day.
